| patient | group | 30 days | 365 days |
|---|---|---|---|
| 1 | treatment | no event | no event |
| 2 | treatment | no event | no event |
| 3 | control | no event | no event |
| 4 | control | no event | no event |
| 5 | control | no event | no event |
Introduction to Data
STA 101L - Summer I 2022
Raphael Morsomme
Welcome
Outline
- Motivating example - stent and stroke
- Principles of statistical inference
- Types of variable
- Experiments and observational studies
Motivating example - stent and stroke
Example - Stents and strokes
Stents are known to reduce the risk of an additional heart attack or death after a cardiac event.
- Could stents have similar benefits for patients at risk of stroke?
- If so, we should use this well-known procedure to reduce the risk of stroke!
- If not, the procedure (surgery) should be avoided.
Does the use of stents reduce the risk of stroke?
We have an experiment with 451 at-risk patients:
- each volunteer patient was randomly assigned to either the treatment (stent) or the control (no stent) group
- check with patients 30 days and 365 days later
30 days |
365 days |
|||
|---|---|---|---|---|
| Group | Stroke | No event | Stroke | No event |
| Control | 13 | 214 | 28 | 199 |
| Treatment | 33 | 191 | 45 | 179 |
| Total | 46 | 405 | 73 | 378 |
Contrary to expectation, we observe more strokes in the treatment group
- Do the data show a real difference between the groups?
- Or is the difference simply due to chance?
This type of questions is central in statistics.
Dealing with Randomness
Suppose I flip a coin \(100\) times and count the number of times I obtain heads.
- I expect to observe about \(50\) heads.
- Imagine that I observe \(85\) heads instead. That would be alarming; the coin is probably not fair.
- If I had observed \(55\) heads then I would not be alarmed; this is a plausible result with a fair coin.
Intuition about randomness
Group exercise - gut feeling about randomness
- In the coin example, what number of heads would start to make you doubt that the coin is fair?
- In the stent study, is the difference large enough to make you doubt that the stents have no effect? In other words, do you think that the difference we observe between the two groups is plausible if stents have no effect?
05:00
Principles of Statistical Inference
Observations and variables
| patient | group | 30 days | 365 days |
|---|---|---|---|
| 1 | treatment | stroke | stroke |
| 2 | treatment | no event | no event |
| 3 | treatment | no event | no event |
- Each row represents an observation
- Each column represents a variable
Some examples
Observational units: individuals, families, student cohort, cities, counties, countries, cells (biology), animals, books, courses, apples
Variables: height, weight, age, size, year, latitude, longitude, type, sex, diet, number of pages, genre, level, color
Population
We are typically interested in the relation between variables in some population.
The population of interest is often large, but with well-defined limits
- e.g. patients at risk of stroke, Duke students, trees in Duke Forest, US counties
- but not the following: people, students, patients.
Census and sample
There are two ways to learn about the relation between variables in a given population.
- Census: collect data on the whole population
ideal
…but typically impractical, expensive
- Sample: small fraction of the population
Statistical inference
- Population parameter, e.g. mean number of hours that Duke students sleep per night
- Greek letter: \(\mu\), \(\beta\), but also \(p\).
- Sample statistic, e.g. observed average number of hours Duke students sleep per night in some sample
- Roman letter: \(\bar{x}\), \(b\), \(\hat{p}\)
- How to learn about the population from a sample?
- …from sample statistics to population parameters
- Statistical inference provides a rigorous framework to accomplish this.
Group exercise - observation and variables
- Consider a study that investigate the effect of diet on sleep among Duke students. What is the population? What is the observational unit? Give three variables that you would want to measure in the study.
- Exercise 1.13 a
- Exercise 2.7
- Give an example of a study in your field. What is the population? What are the observational units? Name a few variables that are measured.
07:00
Statistics as an art – sampling
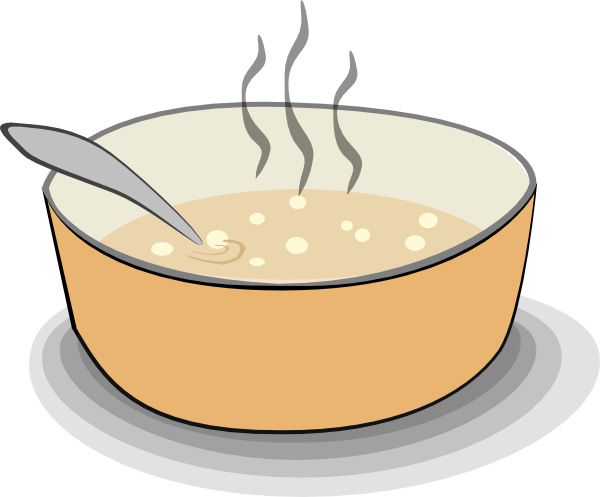
When you make soup, there is no need to drink the whole pot (population) to know if the it is seasoned enough.
- Tasting a spoonful (sample) is sufficient.
- If the soup is well mixed, a spoonful is a representative sample of the population
Group exercise - sampling
Back to the study on the effect of diet on sleep among Duke students. How would you obtain a sample of student for your study if you had (i) 1 hour, (ii) 1 week to collect your data?
03:00
Are all samples created equal? No!
What can go wrong?
- small samples,
- convenience sampling, e.g. students on campus,
- blind spots, e.g. voters with no phone,
- …
Sampling is an art.
Random sample
The gold standard is a random sample
- but even then, we can have non-response bias
🛑 Obtaining a representative sample is difficult.
✅ But surprisingly small representative samples can do the job!
- e.g. 1,500 voters (later in class)
Types of variable
Numerical variables
- Takes a numerical value
- Examples: age, height, number of children
Warning
Not all numbers are numerical variables, e.g. zip code, phone number.
Heuristic: is the average meaningful? Yes!
Numerical variables are either
- discrete, e.g. number of siblings
- or continuous, e.g. a person’s height
- not always clear cut, e.g. GPA
Categorical variables
- Takes a level (a category)
- Examples: eye color, place of birth, education level
Warning
Some numbers are categorical variables, e.g. zip code, phone number.
Heuristic: is the average meaningful? No!
Numerical variables are either
- nominal, e.g. eye color
- or ordinal, e.g. education level
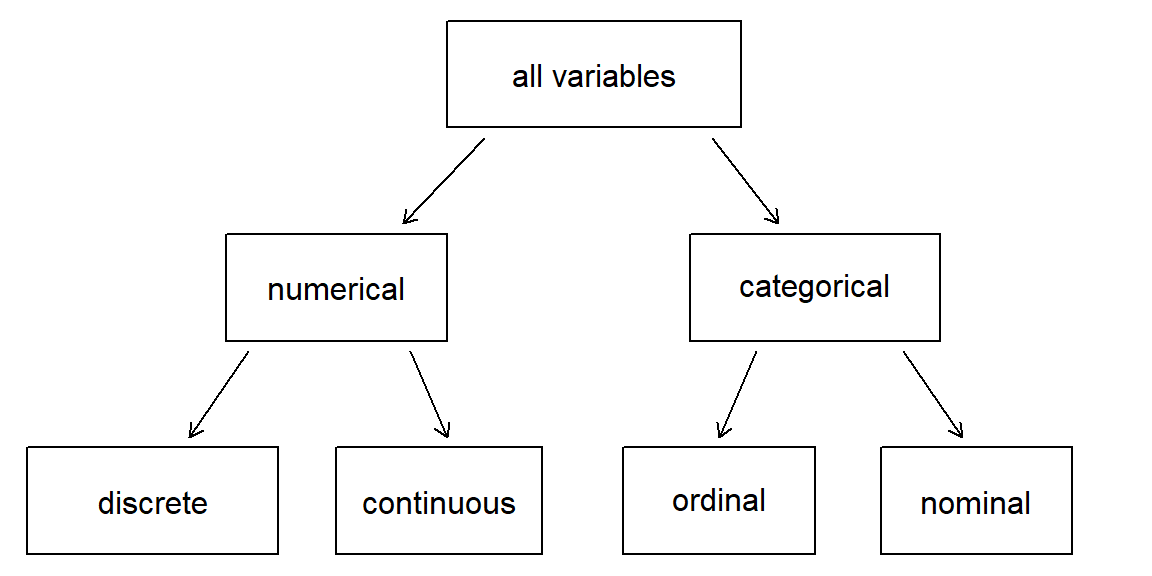
Breakdown of variables into their respective types.
Source: IMS
Group exercise - types of variables
- Exercise 1.13 b
- Consider the study you used in the previous group exercise. Can you identify a numerical and a categorical variable? What are they?
- Does the study consider a variable of all four types? Can you come up with a variable of each type?
05:00
Experiments and observational studies
Relationship between variables
Two variables can either be independent or associated.
If two variables are associated, the association can be
- linear (positive, or negative)
- or it can take any form, e.g. U-shape, inverted-J-shape (like a square root)
Group exercise - types of associations
Provide two numerical variables which you expect to be
- linearly associated; is the association positive or negative?
- associated in a non linear way.
02:00
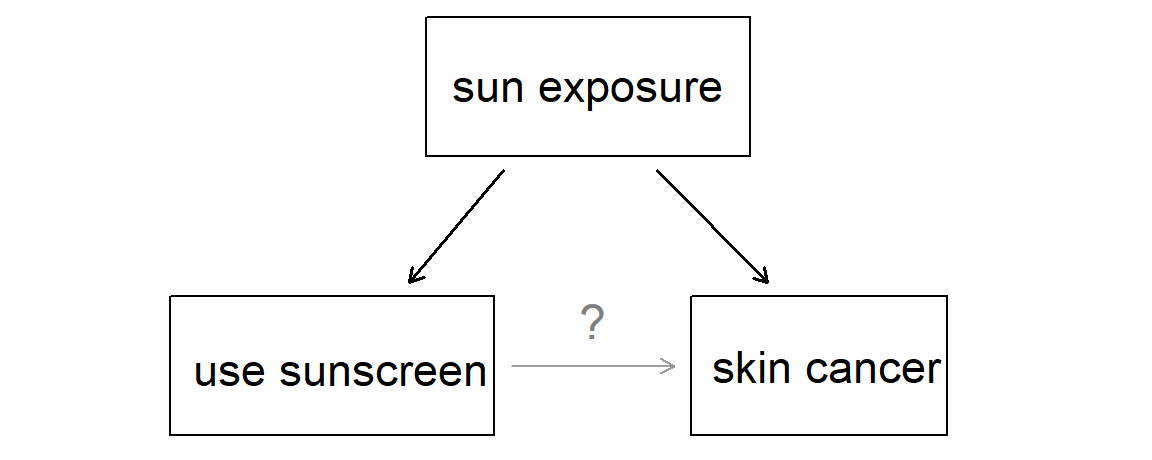
Explanatory and response variable
- When two variables are associated, we sometimes hypothesize that changes in one cause changes in the other.
- Explanatory variable \(\Rightarrow\) response variable
- …but association \(\neq\) causation; examples:
- ice-cream and shark attacks; fire damage and firemen
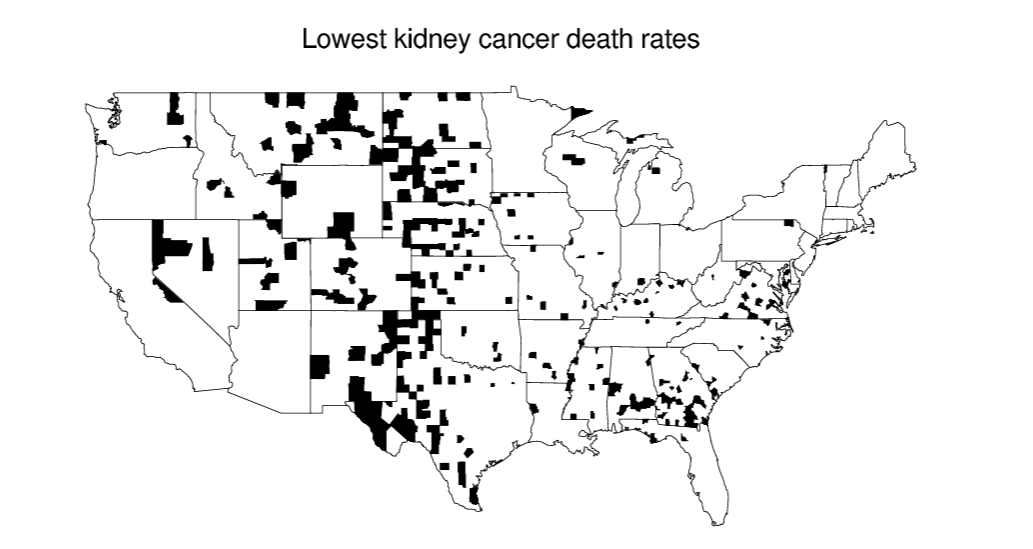
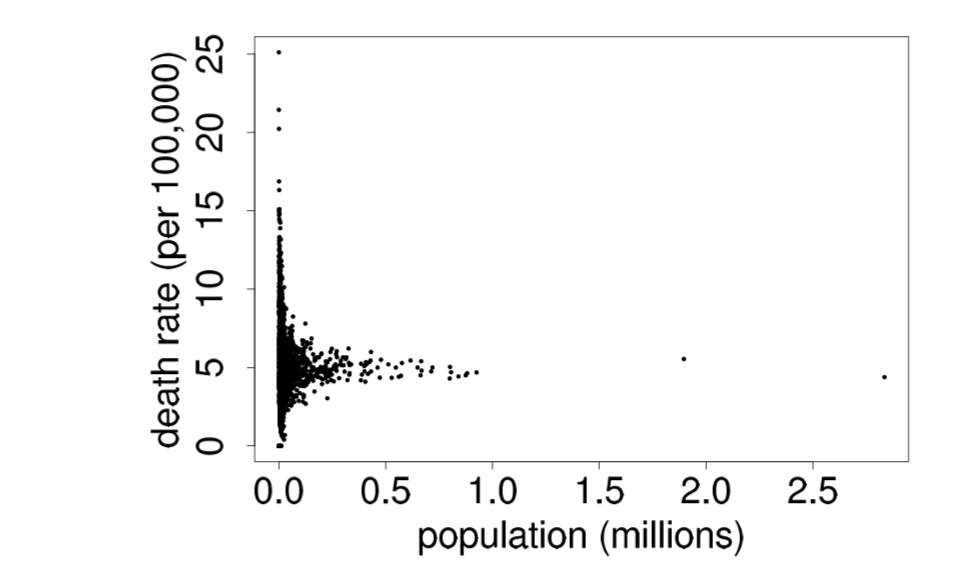
- counties and kidney cancer death rate; the best classrooms are small classrooms, but so are the worst classrooms.
Group exercise - counties and kidney cancer death rate
Why are most of the shaded counties in the middle of the country?
04:00
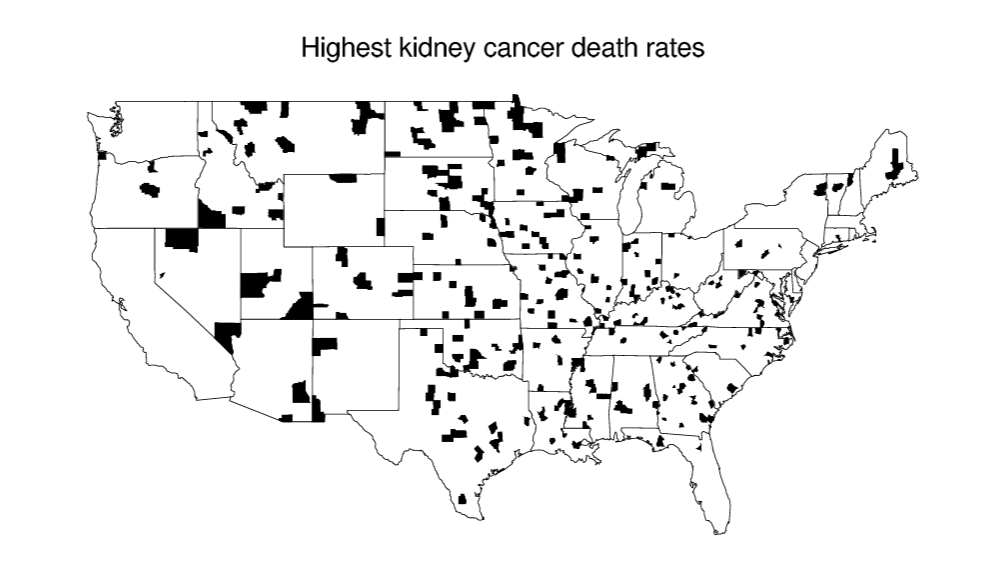 Source: Bayesian Data Analysis
Source: Bayesian Data Analysis
Source: Bayesian Data Analysis
Experiments
- The value of the explanatory variable is assigned by the researcher
- Randomized experiment: the value of the explanatory variable is randomly assigned
- removes any counfounding (lurking) variable, e.g. air temperature
- Blind, or even double-blind, to avoid biases
- placebo
- can go wrong, e.g. vitamins in prison
🛑 we cannot always use experiments:
- not all variables can be assigned, e.g. age
- ethical considerations, e.g. smoking cigarette, sham surgery (placebo)
- practical consideration, e.g. long-term consumption of red meat
✅ But when experiments can be implement, they lead to causal claims and are therefore the gold standard.
Observational Studies
- The value of the explanatory variable is not assigned by the researcher
- there is no interference
- Example: survey
🛑 Does not easily lead to causal claims due to the potential presence of counfounding variables
Source: IMS
…but they can lead to causal claims in certain cases!
- E.g. smoking causes cancer.
Group exercise - experiment and observational study
You want to investigate the effect of caffeine on class participation among Duke students
- Design an observational study.
- Design an experiment.
- Is your experiment double-blind? Can you make it double-blind?
- Do you have any ethical or practical concern with the experiment?
Provide an example of an observational study that you would not turn into an experiment due to:
- practical considerations
- ethical considerations
Exercise 2.12
06:00
Recap
Recap
- observations (row) and variables (column)
- population parameters and sample statistics
- statistical inference
- sampling
- four types of variables
- numerical: continuous, discrete
- categorical: nominal, ordinal
- experiments, observational studies and causal claims